A Project Report on
EVOLUTIONARY ALGORITHM BASED OPTIMIZATION TECHNIQUES FOR DYNAMIC BIDDING STRATEGY
ABSTRACT
Determining optimal bidding strategies in a competitive market to maximize the profit of each bidder is a challenging economic game problem. The bidding processes are dynamic in nature. Every predetermined plan went against the franchises. Hence, they had to realign and respond with a different strategy after each bid by taking into account whether the bid went in their favor or not. The uncertainties in the selection pose a very serious problem. This phenomenon could not be understood by the franchises much.
Get Help With Your Assignment
If you need assistance with writing your assignment, our professional assignment writing service is here to help!
The aim of the project is to determine the optimal bidding strategies in a competitive market to maximize the profit of each bidder in a challenging economic game. The objective is to formulate an objective function for efficient bidding strategy and to implement the evolutionary algorithm based optimization techniques to solve the objective function for the model and with respect to the constraints for effective bidding. Another objective function formulated is used which has been used to explore the implications of bid increments for strategic bid selection.
The objective function formulated is solved by using evolutionary algorithms like Genetic Algorithm and Particle Swarm Optimization. The genetic algorithm is a method used for solving both constrained and unconstrained optimization problems. This algorithm is based on a natural selection process with the aim to mimic biological evolution. The algorithm constantly modifies a population of individual solutions. The genetic algorithm is tested for various sets of parameters such as population, scaling Function etc. This is done to find out the parameters which help in producing most optimal set of values. Particle swarm optimization is a population-based algorithm. It consists of a collection of individuals called particles. These particles move in steps throughout a region. The particle swarm optimization algorithm is tested for various sets of parameters such as population, velocities etc. This is done to find out the parameters which help in producing most optimal set of values. Finally, the performance of the evolutionary algorithms used in solving the formulated objective function is evaluated.
Chapter 1
1. Introduction
1.1 Need for Analytics
Every sport in the past has always been influenced by conservative methods. Every major decision taken by the think tank included the top heads, front office staff and the coach. The decision was emphasized more on gut rather than analytical thinking. But soon a baseball team called Oakland Athletics changed, what has been considered tradition in sports history. Oakland Athletics an underdog team, which had limited financial resources in hand could not match the likes of silver spoon fed teams. But it made use of an approach called “Sabermetrics”. This book was the first to emphasize on team’s analytical and evidence based advancements to come at a conclusion. This approach called Sabermetric approach helped in assembling a winning team in baseball. This helped Oakland Athletics, a team with meagre revenues to compete against other cash giants. This approach was first, followed by Billy Beane, who put together winning teams with limited budgets by selecting undervalued players whose potential was assessed via sabermetrics. This was the first time in the history of sports a high priority was given to statistics rather than the gut feeling. Michael Lewis, a promiment author wrote a book titled “Moneyball: The Art of Winning an Unfair Game”. This book was later made into a movie called “Moneyball” starring Brad Pitt and Jonah Hill and also went on to be nominated for six Academy Awards.
Though sports analytics has been rapidly developing, it has not been the case with cricket. Due to the rise of T20’s the demand for cricket analytics has increased accordingly. Sports analytics play a major role in the optimal team selection of any sport. Some of the problems solved by them include the standing of individual players and their specialized skills, the composition of teams with an optimal balance of dedicated skills, the ranking of teams, the negotiation of contracts and the development of strategies for winning games and tournaments.
Today every professional sport team has been crunching numbers to get a brief understanding of the game. Teams have a dedicated analytics department to give an edge over the opponent. They have also been found to scan any form of data available including coach’s notes convert them to excel tables for the number crunchers to get insightful data out of it. This tendency of using analytics in sports started increasing. This helped in improving the team’s performance on the field. Some teams even adopteed analytics as a core strategy with additional help from coaches, managers and trainers. There is a common belief that analytics will provide with big wins both on and off the field.
1.2 Introduction to Cricket
The sports in the United States of America were the first to make use of analytics. They made use of this statistical information to make better decisions. This was characterized in sports such as baseball and football. In the same time another competitive sport such as cricket has not been revolutionized by analytics. Cricket is played on an oval-shaped playing field and, apart from baseball, is the only major international sport that does not define an exact size for the playing field. The main action takes place on a rectangular 22 yard area called the pitch in the middle of the large playing field. The equipments for playing consist of a ball, bat, stumps and protective gear. The prime equipments are a ball and a bat played between two teams. Each team field a set of eleven players on a cricket field. while a team bats, the opponents bowl and field. The team with the openers out to bat have to score the maximum runs, while the team fielding has to constrict the batsmen from scoring runs. Each period of play is called an innings. An innings gets over if a fixed number of overs get exhausted or all the ten wickets have been fallen for the batting team or if the batting team declares their innings. Once this happens, they swap their corresponding roles The team which outscores the opponents maximum runs or the team that constricts the opponents to score target runs is the one that wins.
When a match begins, two batsmen from a team and eleven fielders from the opponent team come in to the field. The match starts when a bowler of the fielding team bowls a ball from one end of the pitch to another end where a batsman gets ready to face the ball. The batsman faces the ball bowled by the bowler. This batsman is called the striker. While, the other batsman stands near the bowling end called as non striker. The striker has to avoid the ball from hitting the stumps by use of his bat. But the core objective is to score runs by striking the ball well enough such that it crosses the boundary or if they could run between the wickets. The other batsman, known as the non-striker, waits at the opposite end of the pitch near the bowler. The runs are scored if a batsman hits the ball hard enough for it to cross the boundary or if the two batsmen at the crease ie the striker and non striker exchange ends by each concurrently running the length of the pitch in opposite directions whilst the fielders are retrieving the ball. If a run is scored by running a run then the non striker becomes the striker. If a fielder retrieves the ball quickly as much as necessary to put down the wicket with a batsman not having reached the crease at that end of the pitch then that batsman is dismissed. This is called as a run out. But once the batsman loses a wicket, he must depart. He will leave the field giving the oppurtunity to the next batsmen to score runs. The bowler’s objectives is to avert the batsman from scoring runs with the main objective of taking his wicket. An over consists of six deliveries bowled by the same bowler. The next over is bowled from the other end of the pitch by a different bowler. The arbitration of the match proceedings is performed on the field by two umpires.
The other forms of dismissal include a bowled, a lbw, caught out. Bowled happens when the bowler bowls a ball and it hit the stumps knocking the bails of the stumps. LBW also known as leg before wicket happens when the batsmen defends the stumps by his body rather than using his bat. Caught out happens when the batsman hits the ball into the air and it is intercepted by a fielder before touching the ground.
Cricket is classified on the number of days they are played. The three different classifications are, a Test cricket, a one day international and T20 International. Test Cricket is played between the two teams over a duration of 5 days. One day international cricket played between two teams. But each team will play a maximum of 50 overs. A T20 International cricket is played between two teams. But each team will play a maximum of 20 overs. During the past decade and so ckicket has undergone seberal changes with the whole context of making the game more popular among the masses. But also to expand or develop the reach of cricket to non cricket playing nations. Indian Premier League has been a revelation since its inception. It started a revolution in cricket with the main use of 20 over format. This is also the first time in the history of cricket in which auctioning of cricketers was introduced for a healthy competition.
1.3 Dynamics of Bidding
The IPL has been welcomed with wide warm reception. In IPL players are bought with respect to the auction. The bidding processes are dynamic in nature. Every predetermined plan went against the franchises. Hence, they had to realign and respond with a different strategy after each bid by taking into account whether the bid went in their favor or not. The uncertainties in the selection pose a very serious problem. This phenomenon could not be understood by the franchises much.For example, Yuvaraj Singh, a renowned allrounder was the costliest buy of Rs. 16 crores. They had overpaid for a player. They could have easily bought a alternative set of talent at a more cheaper price. The bidding problem starts here as franchises know their budget limits. They have to face the problem in a dynamic environment in which they have to take decisions to get the best of optimal bid. This problem is considered as a strategic bidding problem. There are many approaches to solve this problem, but there are mainly three approaches, first is by calculating market clearing price approach. Second is game theory approach and third is estimate the rival’s bidding approach. The main work of this paper is the use of evolutionary algorithms to solve bidding strategy problem.
Chapter 2
Formulation of Objective Function for bidding strategy
2.1 Introduction
Cricket is a game with a plethora of statistical data. Over multiple games within a series, season, or an entire career, each player accumulates a set of statistics that can be used to compare the performances of different players. Consider an auction in which cricket players are to be bought by respective franchises/bidders. For any franchise prior to the auction they would make a list to have a certain set of players. They also have a budget cap to be set on every individual player. But when the desired player exceeds the mentioned desired budget cap they are in a position to go all out over the player which is not advisable. Here we try to formulate an objective function which will be used to find the alternative player matching the same set of attributes.
Cricket is a game of statistics. Every delivery is an event in itself, full of information that can be used to measure player performance – so many variables, so much data. It is for this reason that providing the best possible context and finding the most significant statistics is not easy. We look at scorecards, series averages and career records, wondering who has produced the best performances. Traditional measures can go some way in making these comparisons, but the application of analytics adds the necessary context.
Cricket fans know that the top scorers and wicket-takers in a match have not necessarily performed the best. Hence, to find the most rounded information of an individual, an objective function is used which helps in showing the well overall picture. At their best, statistics suggest explanations and improve judgement. They are not, as is often believed, the alternative to exercising judgement. With this in mind, statistics that measure players relative to their team would be significant additions to the current set of elementary cricket statistics.
2.2 Quantification of Players
Only three things are counted in cricket: deliveries, runs and wickets. The two most common measurements are the batting average and bowling average. In a limited-overs game, the measures of strike-rate and economy-rate prove to be ample. These measures have endured and even describe thresholds of greatness in some cases such as a batting average above 50, or a bowling average below 25. All these conventional measures consider players individually and help in identifying the better suited individuals for the team.
There are various sets of statistics available. Following are the most important attributes such as
a) Batting Average: A batting average is the number of runs scored per dismissal. The higher the batting average, the better the batsman’s ability to score runs without getting out ie batting average is the total number of runs they have scored divided by the number of times they have been out.
b) Batting Strike Rate: A strike rate is the number of runs scored per 100 deliveries. The higher the batting strike rate, the better the batsman’s ability to score runs quickly.
c) Bowling strike rate: Bowling strike rate is the runs conceded by the bowler per wicket. The lower the strike rate, the more efficient a bowler is at taking wickets quickly.
d) Economy: It is the average runs given per over. The lower the economy, the more efficient a bowler is at limiting the flow of runs.
2.3 Modelling of Objective function
During an auction, a minimum of 500 set of players would go under hammer.For each set of player we have the data which define their attributes. They are being evaluated on three criteria: Batting ability, Bowling ability and fielding ability.
a) Batting ability: Following are the parameters that have been used for evaluation of a player’s batting ability:
1. Batting strike rate- It is runs scored per 100 deliveries.
2. Batting average- It is the average runs scored per innings.
3. Number of half centuries – This indicates the ability of a player to win matches on his own.
The function used to quantify the batting potential of a player is given as follows:
Batting Score=0.5×BA2+0.5×BSR1.5+0.8×H
(1)
where, BA :Batting AverageBSR :Batting Strike RateH :Number of Half Centuries
A square function is used for batting average as the range in batting averages is usually seen to be pretty less. The square function helps in magnifying this difference.Hence, power of 1.5 is used for quantifying the aggressive nature of a player’s batting ability. Same weight is given to both average and strike rate and in absolute terms, strike rate has usually higher value than average and hence, this helps in giving more importance to the aggressive batting ability of a player in evaluation of his overall batting ability. This is in sync with the nature of the T20 cricket. More importance is given to centuries scored by a player as compared to half centuries.
b) Bowling ability: Following are the parameters that have been used for evaluation of a player’s bowling ability:
1. Bowling strike rate- It is the average balls bowled per wicket
2. Economy- It is the average runs given per over.
The function used to quantify the bowling potential of a player is as follows:
Bowling Score=800-ECON3.5-SR1.5
(2)
where,ECON : Bowler’s Economy RateSR :Bowler’s Strike Rate
Bowling score will be a decreasing function of the two parameters as lower the bowling strike rate and lower the economy, better the bowler. A power of 3.5 was used for the parameter economy while a power of 1.5 was used for strike rate as in absolute terms, economy is a much lower number than strike rate. Hence, a power of 3.5 magnifies the difference between bowler’s restrictive bowling ability and helps in better quantification The bowling score is an absolute number.
c) Fielding ability: Following are the parameters that have been used for evaluation of a player’s fielding ability.
1. Catches taken per match
2. Fielding rating –We have used a 0-10 scale to rate a player’s fielding ability based on extensive collation of news, cricketing panel discussions, cricketing sense and subjective analysis.
The function used to quantify the fielding potential of a player is as follows:
Fielding Score=CA×202+FR2
(3)
where,CA :CatchesFR :Field Rating
The coefficient of 20 is used in order to give similar weight to both the parameters. Typically, catches per match for a player is in the range of 0.2-0.5. Hence, coefficient of 20 brings it at par with the 0-10 scale fielding rating. The fielding score is an absolute number.
Overall ability: The weights that have been assigned to different skills of a player are as follows:
1. Batting : 0.35
2. Bowling: 0.30
3. Fielding : 0.15
More weight has been given to batting and bowling as these form the core abilities required for the game. From the equations (1), (2) and (3), the overall objective function is formulated.
The overall objective function is given by:
fx=
(
0.35(0.5×BA2+0.5×BSR1.5+0.8×C+0.3×H))+(0.5(
800-ECON3.5-SR1.5))+(0.15(CA×202+FR2)) (4)
Chapter 3
Evolutionary Algorithms
3.1 Introduction
A comprehensive review of optimal bidding strategies in auction has been published. A strategic bidding problem is solved using Dynamic Programming (DP) based approach. Integer Programming has been adopted. Here, Evolutionary algorithms are used as they result in faster convergence. The biological model of evolution and natural selection have always been admired by scientists. One of the greats, Charles Darwin inspired from surroundings first proposed Evolutionary algorithms (EAs). Evolution has always been emphasized on fitness ie the ability to adapt to environments.
Every species has been subjected to adaptations. This ability of flexibility has paved way for mutation to take place. Though some mutational changes were beneficial many of them proved to be unfavorable for survival. Every development of a species comes from exchanging information among themselves hence providing a way for natural selection. The living beings which are able to survive lengthy periods in hot, dry and harsh conditions are the one which are able to survive with meager quantity of water supply. In the same way the living beings whose heart beats maximum are the ones who run faster. the heart is able to pump more blood which results in speed thus resulting in catching their own food which are obviously the ones who are slow. A small change in genome which results in modification of genetic setup helps in evolution of a species with higher chances of survival. These species which underwent gene change are the ones which are able to have dominant genes. This information occurs in the form of gene exchange.
Many discoveries and inventions have been inspired from the application of biological and/or natural principles. These have helped to mimic the same to the study and design of human systems. Many inventions have been inspired from living organisms such as mimicking bats to invent radar, fishes to invent submarine, etc. All the living beings have so far survived by adapting to the changing world. By knowing their adaptations and mimicking the same we could know the ways of optimizing our own livelihood byt he principle of survival of the fittest. Evolutionary algorithms are inspired by the same concept. EA help in optimizing our ability to progress by maximizing the payoffs. They have three main characteristics:
a) Population based: The evolutionary algorithms have a group of solutions called population. This population helps in the convergence and optimization of fitter individuals.
b) Fitness oriented: The population consists of solution space. Every solution in a population is called an individual. Every individual is represented by a gene. This gene representation is called code. Their corresponding performance evaluation is called fitness value.
c) Variation driven: Every individual will go through a plethora of changes finally to mimic the necessary change in gene. These changes help in searching through the solution space. To solve a particular problem we create an environment in which potential solutions can evolve. The parameters which are given as input to the problem help in resulting in the production of better outcome of results. There are different types of evolutionary algorithms. Some of them are particle swarm optimization, genetic algorithm, simulated annealing, differential evolution etc In this paper, the bidding strategy problem is modeled as an optimization problem. This problem is also solved using Evolutionary Algorithms comprising Particle Swarm Optimization (PSO) and Genetic Algorithm(GA). Both techniques comprising PSO and GA share approximately same set of pattern in computation. At first a population is initialized. Then random particles are individuals are scattered over the solution space. Then updates are done until a optimal solution of generations are found. But genetic algorithm differs with particle swarm optimization with the use of techniques such as crossover and mutation.
3.2 Particle Swarm Optimization
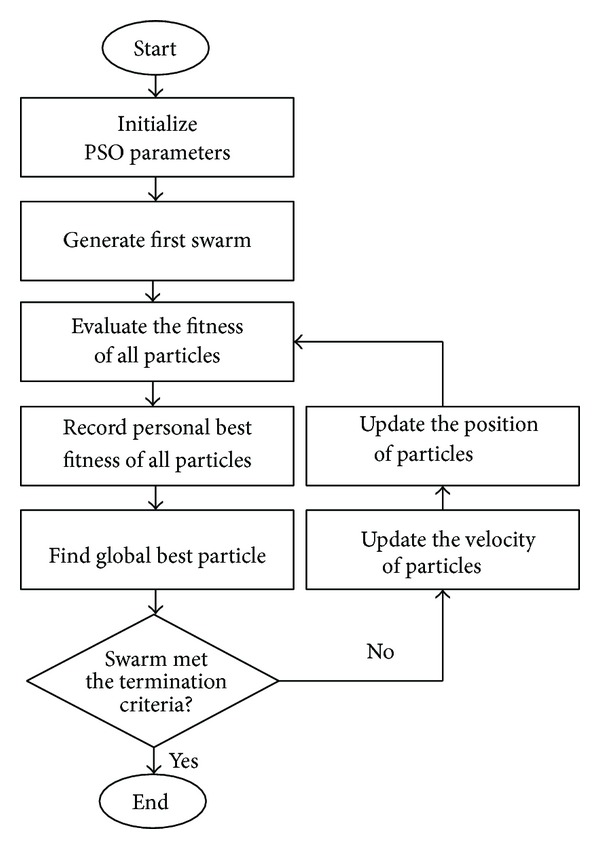
In 1995, Kennedy and Eberhart invented an optimization method called particle swarm optimization (PSO) based on the ability of natural living beings to adapt to the surroundings by mimicking their techniques. The idea was to mimic the ability of a bird flock to fly synchronously, change directions suddenly, scatter, and regroup.
Consider a flock of birds flying together in search of food. the locality they search is the solution space. A flock consists of several birds. Each bird has a sight on their own finding of prey. But rather than being selfish, they pass on information of their own findings within the group. This frequent exchange of information results in a ultimatum which is finding the best place for its prey. Both the scientists Kennedy and Eberhart made use of the position and velocity. Each bird which is a solution searches in a location called search space. This is called as a particle. Each of the bird or the particle have their own corresponding fitness values. These fitness values which are evaluated by the fitness function. This function is the objective function to be optimized in terms of minimization or maximization. The birds or particles fly through the locality or problem space by following the current optimum particles. At first, population of random solutions are initialised. They keep on updating with respect to the updation of optimal solutions with the use of both positon and velocity. Finally, they result in optimal results.
Following are the steps for PSO in obtaining optimal bidding coefficients:
- Initialise the particles.
- Assign the parameters, constraints, initial values for position and velocity.
- Calculate the fitness values.
- Calculate their objective values and initialize the personal best locations and the overall best location accordingly.
- After finding the two best values, the particles are updated with respect to velocity and postion.
- Repeat 3,4,5 until convergence is met.
- End
3.2.1 Setting optimal parameters
The bidding strategy is a problem. This problem is modeled as an optimization problem and solved using PSO. The objective function is solved for a particular set of constraints for the various attributes defining the equation such as batting average, batting strike rate, number of centuries and half centuries, bowling stike rate, economy, caches and field rating. Various set of parameters were tested out to find out the most optimal variant resulting in maximizing the pay off. The number of particle was varied from 10 to 50. Then they are tested out to find the optimal values of c1 and c2 resulting in faster convergence.
3.3 Genetic Algorithm
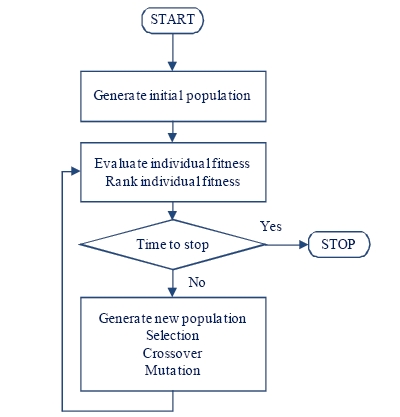
In genetic algorithm, we have a population. Each population comprises of individuals. Population size is the number of individuals in the population. Each individual has two properties: its location and its quality. This location is composed of genes. The quality is composed of fitness value. The selection process helps in the generation of next generations from the high quality individuals. Individuals in the mating pool are called parents. Two parents are selected to generate two off springs. Then every offspring might undergo small changes, hence becoming a new individual. Then the newly generated population replaces the old one and another generation starts. All the following above follow the principle of Darwinian natural selection theory. According to this principle, selection helps in finding the survival of the fittest. The two parents generating offsprings help in gene crossover and recombination, hence helping in gene makeup. All the small changes in the location of the offspring leads to the mutation. A better individual has more chances to be selected into the mating pool. Hence it has more chances to mate the higher quality genes than low-quality individuals. Thus resulting in better individuals. These better individuals contain information or gene which is passed on to next generation to produce even better quality of individuals. Thus the population will become more optimal till the convergence goes on untill a there’s no optimal to be reached. Thus the solution is found. This is how genetic algorithm has a upper hand over other conventional algorithms.
A genetic algorithm is one in which a population of prospect candidates have solution to an optimization problem thus evolving towards a better solution. Each prospect solution has a set of properties which can be mutated and altered.
Each evolution has a set of population. Each population comprises of individuals. Each individual have a fitness value. This fitness values tells us how good are they at reaching their optima. It also says the value of the objective function in the optimization problem being solved The individuals with higher fitness cross between each other producing next generation of better quality individuals. In each generation, the fitness of every individual in the population is evaluated.. The new generation of individuals are then used in the next iteration of the algorithm. Commonly, the algorithm terminates when either a maximum number of generations have been produced.
Following are the steps for GA in obtaining optimal bidding coefficients:
1. Initialise the particles..
2. Initialize the parameters and constraints.
3. Calculate the individual fitness and rank them.
4. Generate new population by Selection, Crossover and Mutation
5. Repeat steps 3 and 4 until convergence is met.
6. End
3.3.1 Setting optimal parameters
The bidding strategy problem is modeled as an optimization problem and solved using GA. The objective function is solved for a particular set of constraints for the various attributes defining the equation such as batting average, batting strike rate, number of centuries and half centuries, bowling stike rate, economy, caches and field rating. Various set of parameters were tested out to find out the most optimal variant resulting in maximizing the pay off.
Find Out How UKEssays.com Can Help You!
Our academic experts are ready and waiting to assist with any writing project you may have. From simple essay plans, through to full dissertations, you can guarantee we have a service perfectly matched to your needs.
View our academic writing services
3.3.2 Initialization
The population size depends on the nature of the problem, but typically contains several hundreds or thousands of possible solutions. Often, the initial population is generated randomly, allowing the entire range of possible solutions (the search space). Occasionally, the solutions may be “seeded” in areas where optimal solutions are likely to be found. Various sets of parameters were tested out to find out the most optimal variant resulting in maximizing the pay off. The number of particle was varied from 10 to 50.
3.3.3 Selection and Fitness Scaling
After initialization, the genetic algorithm enters the main loop. It starts with a selection process, which imitates natural selection by granting fitter individuals higher opportunity to breed, and ends with two variation operators. These operators include crossover and mutation. The crossover and mutation define the imitation of natural reproduction by exchanging genes of parents to generate offspring.
During each successive generation, a portion of the existing population is selected to breed a new generation. Individual solutions are selected through a fitness-based process, where fitter solutions are typically more likely to be selected. Certain selection methods rate the fitness of each solution and preferentially select the best solutions.
Fitness scaling converts the raw fitness scores that are returned by the fitness function to values in a range that is suitable for the selection function. The selection function uses the scaled fitness values to select the parents of the next generation. The selection function assigns a higher probability of selection to individuals with higher scaled values.
The range of the scaled values affects the performance of the genetic algorithm. If the scaled values vary too widely, the individuals with the highest scaled values reproduce too rapidly, taking over the population gene pool too quickly, and preventing the genetic algorithm from searching other areas of the solution space
The default fitness scaling option, Rank, scales the raw scores based on the rank of each individual instead of its score. Proportional makes the expectation proportional to the raw fitness score. Shift linear scales the raw scores so that the expectation of the fittest individual is equal to a constant, which you can specify as Maximum survival rate, multiplied by the average score. The fitness scaling functions such as rank, proportional and shift linear are varied to find the function with better convergence.
Chapter 4
Auction Process
4.1 Introduction
The word “auction” is derived from the Latin “auguere” which means “I increase”. Auction has been one of the best modes for negotiation of goods and commodities. Though auction may be a old idea, its being still used in this modern world. Auctions are more common in determining the price of various commodities such spices, perishable items(vegetables,meat etc), radio spectrum and antiques. Technology companies such as Google, ebay etc have used auction as a prime model for determining the price of an item. Auction has been a integral part of Indian Premier League. The bids in the auction are classified in two primary ways. First one is the English auction, in which the auctioneer starts from a base price in the increasing order such that the buyer who bids the highest gets the item. Second one is a Dutch auction, in which the auctioneer starts with the highest bid and starts lowering in the decreasing order until a bidder matches the price. There is another auction called Sealed bid auction, in which various players bid for an item. They need to specify the maximum price they are willing to pay for the particular item. The bid are sealed such that the player wont be knowing the bids of the rival players.
4.2 Hybrid Auction
There are various types of auction in which the buyer who is paying for the item pays in different formats according to the type.
1. First Price Auction: The buyer pays for the maximum amount he has bid.
2. Second Price Auction: The buyer is the winner of the particular item he has bid for the maximum amount but he need not pay the same. Rather, he should pay the second maximum bid specified by his runner up. There is another type called hybrid auction, which is the hybrid between first price and second price auction. This auction format helps in bringing up a equilibrium in which the successful bid is always lower than the maximum bid the player has destined to pay and also greater than the second price bid. Electronic auctions are generally considered as second-price auction. This is due to the fact that once all bidders have submitted their final private bids, the winner is the one who pays the price of next maximum value to his bid. An important inference is that every bidder’s private value is unknown to the opponents, hence one need to shell out the maximum price one needs to pay. Electronic auctions are one of the important technological mechanisms modern exchange. The major players include Google, Yahoo, eBay Amazon etc. They are known for their unique ability to lure the customers as well luring the sellers at the same market place. This online auction resembles same in some of the features to traditional auction formats. In online auction, a potential buyer bids a the amount he wants to pay. This amount may also include the maximum he desires to shell out. This amount is only known by the software of the corresponding technological company. This software then competitively bids as low as possible on the bidder’s behalf. Until it reaches the maximum bid of the bidder. Various technological companies have their own proprietary software’s. When this software overtakes one bidder’s bid on behalf of another, it forces the new lead bidder, whenever possible, to surpass the former lead bidder by a discrete amount, called a bid increment. Increments are fixed beforehand by the online auction house, and are known to both buyers and sellers. This understanding is reflected in advice that eBay supplies to bidders. The eBay help page suggests the users to bid the maximum amount the users desire to shell out. And also vouch their system suggesting they automatically increase our bids to the maximum price specified. But the rule of pricing is very complex in online auctions. They are more complex due to the presence of bid increments. When the proprietary software overtakes one bidder’s bid on behalf of another, it forces the new lead bidder to surpass the former lead bidder by a bid increment delta. But when two bidders are closer to delta there is a sudden leap in the entire amount of delta which crosses the maximum bid of the lead bidder. In this case, the price is set exactly equal to the high bid. Hence we need to maximize the bid. This hybrid auction helps us do that.
4.2.1 Maximizing the payoffs
This new hybrid auction is used to maximize the payoffs such that the equilibrium bid is always below the private value. A Bayes-Nash Equilibrium bidding function is used to maximize the pay off of the private bids. The differential equation is used to maximize is given by
β’=υ-βυgυGυ-Gβ-1βυ-∆
(5)
where,υ – private value;βυ -bid;
g(v)
– distribution of opponent private value;
G(V)
–density of opponent private value
∆
–Delta(increment)
The estimate approximation of the above differential equation is solved by a numerical method. One of the most prominent method to produce approximation of greater accuracy is Runga-Kutta method. Higher order methods give far more accuracy. This differential equation is solved by fourth order Runga-Kutta method. We use the following slope approximations to estimate the slope at some time t₀.
k1=f(y∗(t0),t0) (6)
k2=f(y∗(t0)+k1h2,t0+h2) (7)
k3=f(y∗(t0)+k2h2,t0+h2) (8)
k4=f(y∗(t0)+k3h,t0+h) (9)
Each of the slope estimate are used for estimation. k1 is the slope at the beginning of the time step. The slope k1 to step halfway through the time step and then k2 is an estimate of the slope at the midpoint. This is the same as the slope, k2, from the second order midpoint method. This slope proved to be more accurate than k1 for making new approximations for y(t). Using the slope k2 to step halfway through the time step, then k3 is another estimate of the slope at the midpoint. Finally, the slope, k3, to step all the way across the time step (to t₀+h), and k4 is an estimate of the slope at the endpoint. The weighted sum of these slopes is used to get our final estimate of y*(t₀+h)
y∗(t0+h)=y∗(t0)+((k1+2k2+2k3+k4)h)/6=y∗(t0)+(16k1+13k2+13k3+16k4)h (10)
The distribution function Weibull is used. Jeff Weibull invented this function and it became so popular that local statisticians named it after him as “Weibull Distribution”. Jeff Weibull was like a chameleon able to adaptive to the people he was with. Correspondingly, his function is more versatile that it matched every distribution. The values are distributed Weibull. It is also showed how the bid increments result in the change of payoffs. The comparison of private values to bid with respect to bid increments is calculated and comparison is done.
Chapter 5
5. Result and Discussions
The PSO is tested for various set of parameters to find the optimal parameters suited for the bidding strategy. The objective function is solved for a particular set of constraints for the various attributes defining the equation. These attributes include the batting average, batting strike rate, half centuries , half centuries, bowler’s economy, bowler’s strike rate, catches and the field rating. These parameters form the bound for the function. Finally, the objective function is solved with respect to constraints such as
Table 5.1. Constraints for the objective function used in PSO
| Parameter | Lower Bound | Upper Bound |
| Batting Average | 10 | 60 |
| Batting Strike Rate | 100 | 300 |
| Field Rating | 1 | 10 |
| Half Centuries | 1 | 50 |
| Bowler’s Economy | 0 | 30 |
| Bowler’s Strike Rate | 0 | 100 |
| Catches | 1 | 10 |
Initialization of population is the first step in the process. Since the cost of early mistake is very high, various set of parameters with respect to population were tested out to find out the most optimal variant resulting in maximizing the pay off. The number of particle was varied from 10 to 50.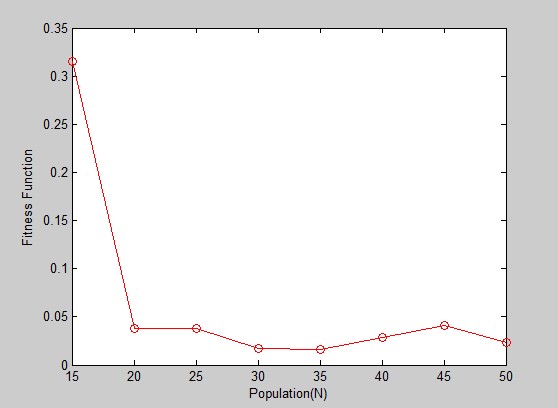
Fig. 5. 1 Comparison between different values of Population in PSO
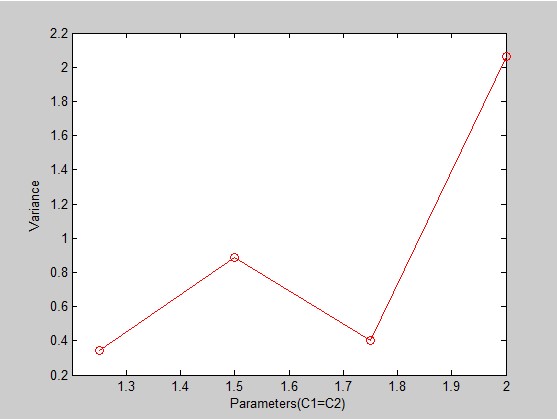
Fig. 5. 2 Comparison between different values of c1 and c2 in PSO
Once the optimal population is found c1 and c2 were varied for faster convergence. The values of c1 and c2 which define the importance of personal best and neighbourhood best respectively were varied.
Finally, the optimal set of parameters is found with inital optimal population as 35 and optimal neighbourhood and personal values c1 and c2 both equal to 1.25.
Similarly for GA, testing of various parameters was done to find the optimal one. A genetic algorithm requires solution domain and a fitness function. The solution domain must be represented by genetic representation. The genetic algorithm initializes a population of individuals based on both the genetic representation and fitness function. Then the generations are updated with respect to the operators such as mutation, crossover, inversion and selection operators to produce better class of individuals in next generations. The GA is tested for various set of parameters to find the optimal parameters suited for the bidding strategy. The objective function is solved for a particular set of constraints for the various attributes defining the equation. These attributes include the batting average, batting strike rate, half centuries , half centuries, bowler’s economy, bowler’s strike rate, catches and the field rating. These parameters form the bound for the function. Finally, the objective function is solved with respect to constraints such as
The objective function is solved for a particular set of constraints for the various attributes defining the equation. Such as
Table 5.2 Constraints for the objective function used in GA
| Parameter | Lower Bound | Upper Bound |
| Batting Average | 10 | 60 |
| Batting Strike Rate | 100 | 300 |
| Centuries | 1 | 10 |
| Half Centuries | 1 | 50 |
| Bowler’s Economy | 0 | 30 |
| Bowler’s Strike Rate | 0 | 100 |
| Catches | 1 | 10 |
Initialization of population is the first step in the process. Since the cost of early mistake is very high, various set of parameters with respect to population were tested out to find out the most optimal variant resulting in maximizing the pay off. The number of particle was varied from 10 to 50. A genetic algorithm requires a fitness function. Fitness scaling converts the raw fitness scores that are returned by the fitness function to values in a range that is suitable for the selection function. The selection function uses the scaled fitness values to select the parents of the next generation. The selection function assigns a higher probability of selection to individuals with higher scaled values. Hence selection of proper fitness function is a most important task to be carried on. The default fitness scaling option, Rank, scales the raw scores based on the rank of each individual instead of its score. The following are the observations found by using rank as a scaling function.
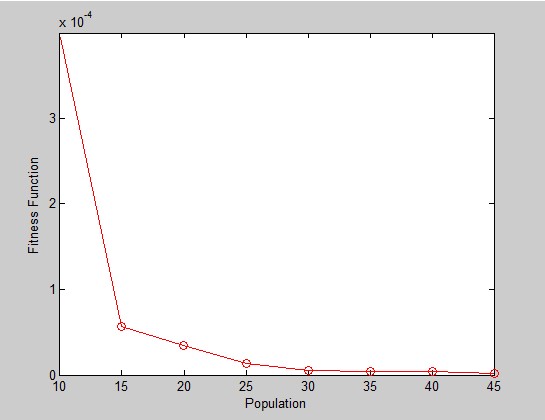
Fig. 5. 3 Variance for different population with Rank
Selection of proper fitness function is a most important task to be carried on. Proportional makes the expectation proportional to the raw fitness score. . The following are the observations found by using proportional as a scaling function.
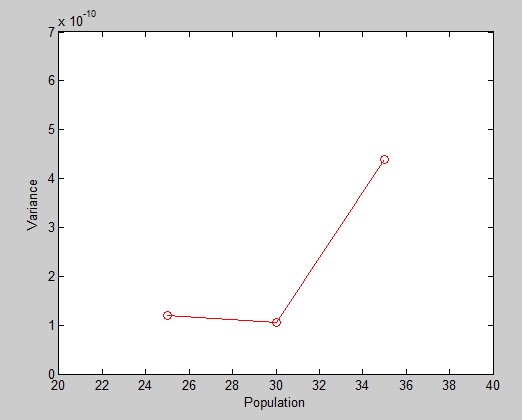
Fig. 5. 4 Variance for different population with Proportional
Shift linear scales the raw scores so that the expectation of the fittest individual is equal to a constant, which you can specify as Maximum survival rate, multiplied by the average score.
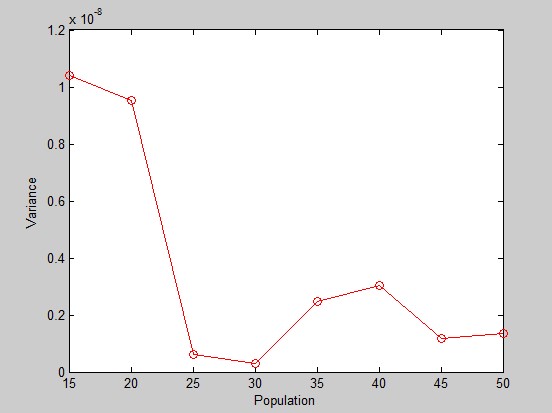
Fig. 5. 5 Variance between different population with Shift Linear
The fitness scaling functions such as rank, proportional and shift linear are varied to find the function with better convergence. Finally, proportional as a scaling function is found to give the most optimal output.
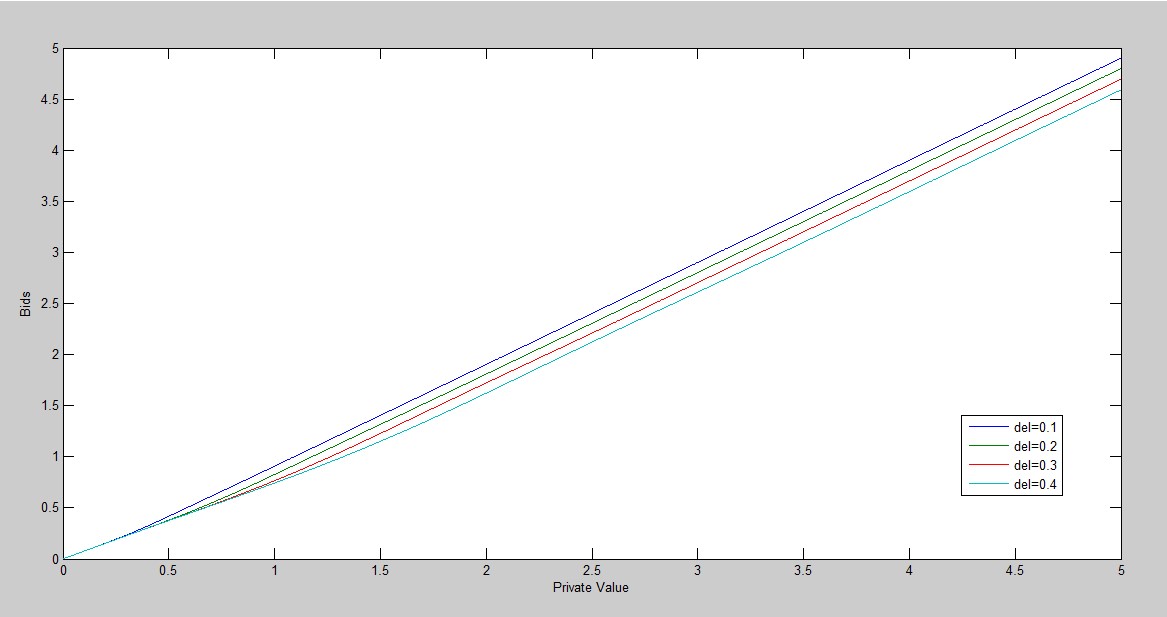
Fig. 5. 6 Sensitivity in changes in delta with respect to bids
Consider a hybrid auction with 5 number of bidders. And 5 is the maximum amount desired to be paid. The values are weibull distributed and follow fourth order Runga-Kutta Algorithm. The private values are estimated for the bid increments of 0.1, 0.2, 0.3 and 0.4. The values are plotted on the graph. It is found that private values always remain below the maximum bid.
Cite This Work
To export a reference to this article please select a referencing style below:


