Venessa Daly
Objectives:
- To determine the effect enzyme concentration has on catalase activity
- To study the effect substrate concentration has on the rate of catalase activity
- To establish the effect temperature has on the activity of catalase
Introduction:
Enzymes control almost all cellular reactions. Enzymes are large globular proteins that act as catalysts in biochemical reactions. A catalyst reduces the activation energy needed for a reaction to occur, thus affects the reaction rate. Enzymes are very sensitive, they are affected by temperature and pH. Enzymes work as catalysts by combining with a substrate at the active site to form the enzyme-substrate complex, this then breaks down to release the enzyme and the product. Enzymes are shape specific, which means only substrate molecules with the corresponding shape will combine with the enzyme. This is known as the Lock and Key theory. So, because of this many different enzymes can be present in a cell, acting at the same time but not affecting each other. Enzymes are recovered unchanged from reactions so they can be reused again and again. Eventually, the effectiveness of the enzyme decreases over time and must be replaced. Enzyme activity can be measured by: measuring the rate of formation of a product and measuring the rate of disappearance of a substance.
Catalase is an enzyme found in almost all living organisms. It is a very important enzyme as it prevents the build-up of toxic hydrogen peroxide in cells. It catalyses the decomposition of hydrogen peroxide to water and oxygen.
 2H2O2 2H2O + O2
Enzymes are affected by enzyme concentration, substrate concentration and temperature. As enzyme concentration increases the rate of reaction also increases linearly. However, once it reaches a very high enzyme concentration, the substrate concentration reaches a rate-limiting and the rate stops increasing. As the substrate concentration increases, the rate also increases. At higher concentrations, the enzymes become saturated with substrate so there a very few free enzyme molecules. So, adding more substrate would make no difference. The enzyme activity increases as temperature increases until an optimum temperature is reached. Once the optimum temperature is reached, if the temperature is increased any more then there is a decline in enzyme activity. Enzymes become denatured at a high temperature, the enzyme can then no longer carry out its function correctly.
Method:
A fresh potato was peeled and cut into small cubes. 100g of the tissue was weighed out. The potato, 100ml of cold distilled water and a small amount of crushed ice was placed into a pre-chilled blender. This was then homogenised for 30 seconds at high speed. The potato mixture was filtered. The filtrate was poured into a 100ml graduated cylinder. Cold distilled water was added to bring the volume to 100ml.
Get Help With Your Essay
If you need assistance with writing your essay, our professional essay writing service is here to help!
100, 75, 50, 25, and 0 units/ml of enzyme concentrations were made up, (the total volume in each should be 40mls). 40ml of 1% H2O2 solution was placed into five different beakers. Forceps were used to fully immerse a glass fibre disc into the first of the catalase solutions (100 units/ml). The disc absorbed the enzyme solution for 5 seconds, it was removed and allowed to drain for 10 seconds. The disc was then dropped into the first beaker of H2O2. The time was then recorded from the moment the disc touched the surface to the moment it reached the surface again. This was done with two separate discs and the average time was got. This was then repeated for each of the enzyme solutions. The rate of reaction versus enzyme concentration was then plotted.
40mls of 0.1%, 0.2%, 0.5%, 0.8%, 1%, 5% and 10% hydrogen peroxide solutions we added to seven separate beakers. Forceps were used to fully immerse a glass fibre disc into 100 units/ml of the catalase solution. It was removed from the catalase after 5 seconds and allowed to drain for 10 seconds. The disc was then dropped into the 0.1% hydrogen peroxide solution. The time was recorded from the moment it touched the surface to the minute it reached the surface again. This was done twice with two separate discs and the average time was got. This was done using all the substrate solutions. The rate of reaction versus substrate concentrations were plotted.
Water baths were set up at the temperatures: 0oC, 150C, 250C, 300C, 370C, 450C and 600C. 40mls of 1% hydrogen peroxide and 40mls of enzyme solution were incubated separately at each of the temperatures for 5 minutes. After the 5 minutes, a glass fibre disc was fully immersed into the enzyme solution for 5 seconds at 00C, using forceps. It was then removed and allowed to drain for 10 seconds before the disc was dropped into the beaker of the hydrogen peroxide. The time was recorded from the moment it touched the surface to the moment it reached the surface again. This was done twice using two separate discs each time at each temperature. The rate of reaction versus temperature was then plotted.
Results:
|
Concentration |
Time |
Average Time |
1/Time |
|
|
25% |
22 |
22 |
22 |
0.045455 |
|
50% |
15 |
14 |
14.5 |
0.068966 |
|
75% |
14 |
12 |
12.5 |
0.08 |
|
100% |
10 |
8 |
9 |
0.1111111 |

|
Concentration |
Time |
Average Time |
1/Time |
|
|
0.1% |
46 |
42 |
44 |
0.022727 |
|
0.2% |
32 |
29 |
30.5 |
0.032787 |
|
0.5% |
18 |
16 |
17 |
0.058824 |
|
0.8% |
14 |
12 |
13 |
0.076923 |
|
1% |
8 |
10 |
9 |
0.11111 |
|
5% |
5 |
3 |
4 |
0.25 |
|
10% |
2 |
1 |
1.5 |
0.666667 |

|
Temperature (0C) |
Time |
Average Time |
1/Time |
|
|
0 |
16 |
15 |
15.5 |
0.064516 |
|
15 |
13 |
11 |
12 |
0.08 |
|
25 |
10 |
11 |
10.5 |
0.095238 |
|
30 |
10 |
9 |
9.5 |
0.105263 |
|
37 |
5 |
8 |
6.5 |
0.153846 |
|
45 |
9 |
15 |
11.5 |
0.08 |
|
60 |
149 |
157 |
153 |
0.006536 |

Discussion:
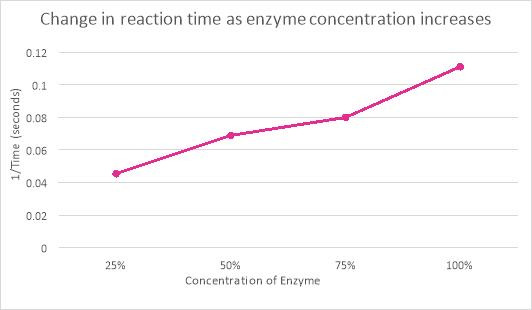
The effect the change of enzyme concentration had on the reaction time of catalase activity can be observed from the graph and table (a). When the enzyme concentration was 25%, the rate of reaction was 22 seconds. However, when the enzyme was at 100% the reaction occurred within 9 seconds. This was a difference of 13 seconds and a concentration change of 75%. The reason there was such a difference in the rate of reaction was because there was more enzyme concentration than substrate so the enzymes could easily react.
Find Out How UKEssays.com Can Help You!
Our academic experts are ready and waiting to assist with any writing project you may have. From simple essay plans, through to full dissertations, you can guarantee we have a service perfectly matched to your needs.
View our academic writing services
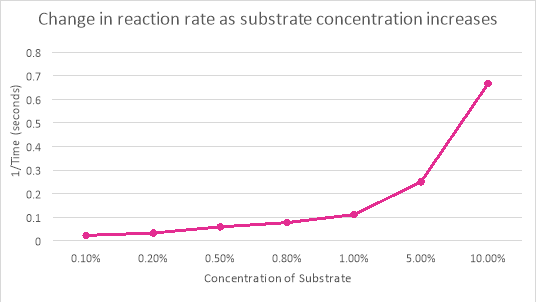
The change of concentration in the substrate had a huge effect on the rate of reaction of catalase, this can be observed from table and graph (b). The reaction time was 44 seconds when the substrate concentration was 0.1%. When that concentration was 10% the reaction time was a quick 1.5 seconds. This proves that as the concentration of substrate increase so does the rate of reaction. However, if the concentration was continued to be increased eventually there would be very little free enzymes left so the rate of reaction slows down.
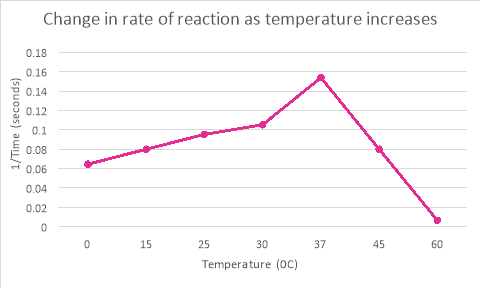
It is clear from the table and graph (c) that enzymes optimum temperature is 37oC. The rate of reaction increases as the temperature increases up to 37oC, any temperature increase after that causes the rate of reaction to decrease. The enzymes begin to denature in any temperature higher than their optimum temperature.
Conclusions:
It is very important to understand what affects the rate of reaction in relation to enzymes in catalase activity. Enzymes control nearly all biological reactions, so this means it controls anything from digestion to tissue repair in the body. Enzymes are commonly prescribed to animals when a body process isn’t functioning properly. So, it is essential to know what factors affect the productivity of enzymes to enable the correct treatment is given to the animal.
Reference:
S. Marsden (2008) Enzymes. [Online]. Available at: https://vcahospitals.com/know-your-pet/enzymes [Accessed 18 February 2017].
Cite This Work
To export a reference to this article please select a referencing style below:


